
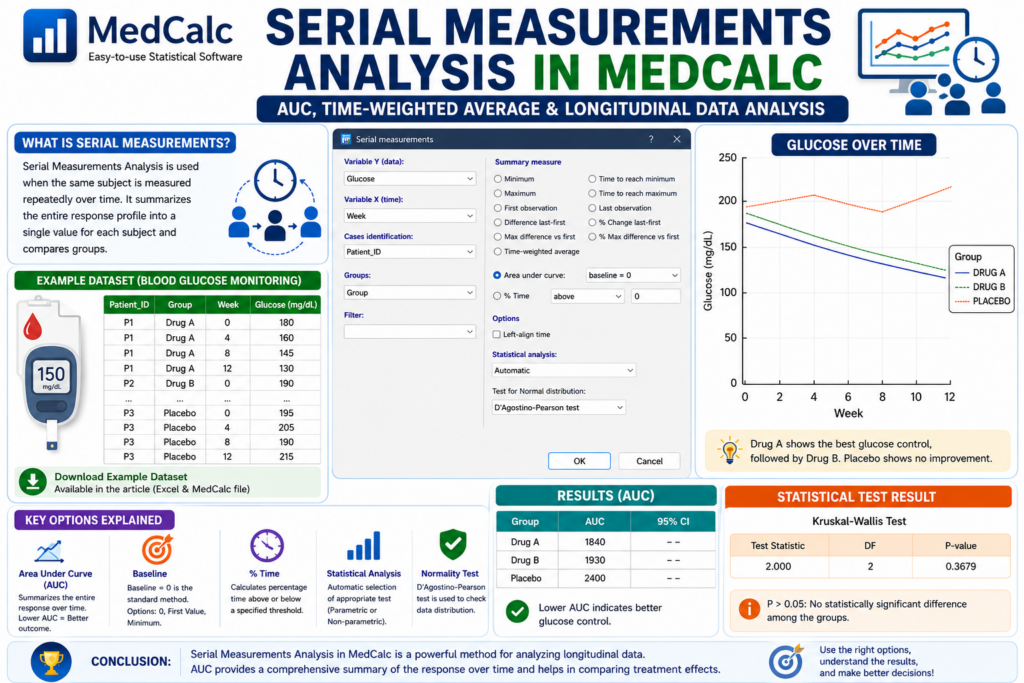
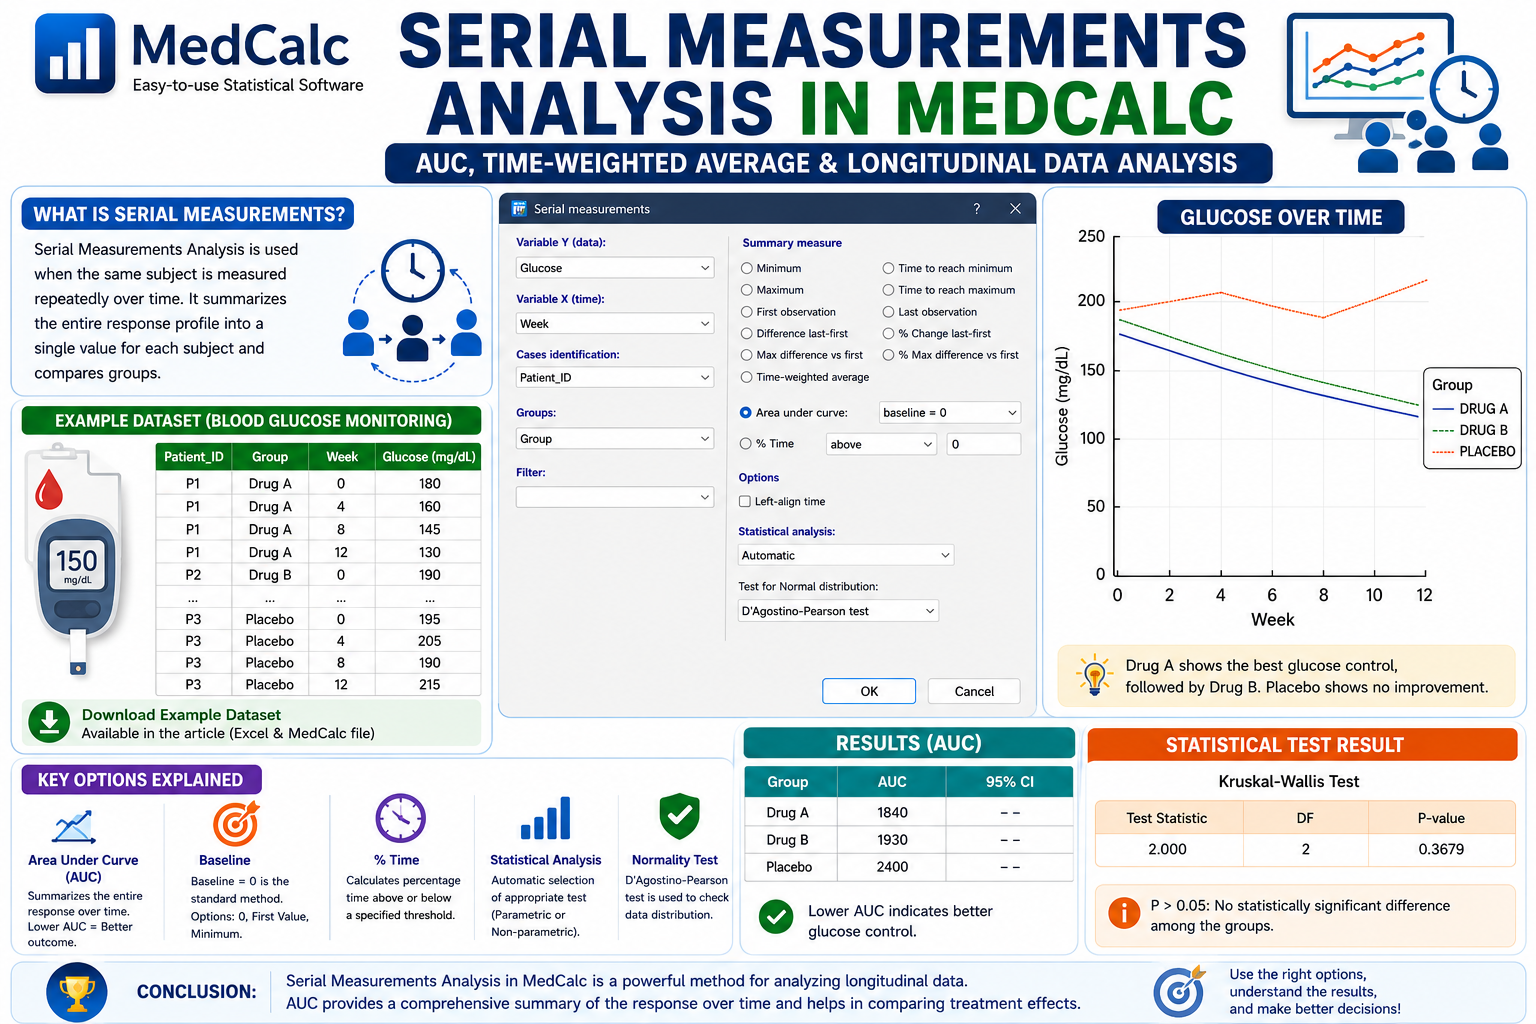
Introduction In biomedical and clinical research, measurements are often

Time Series Regression in R Studio: An Environmental Health Case Study
Introduction Time series regression is a powerful statistical technique widely

Boxplot with Individual Data Points Overlaid in R Studio (with Full R Script & Step-By-Step Guide)
Introduction Data visualization is one of the most essential steps
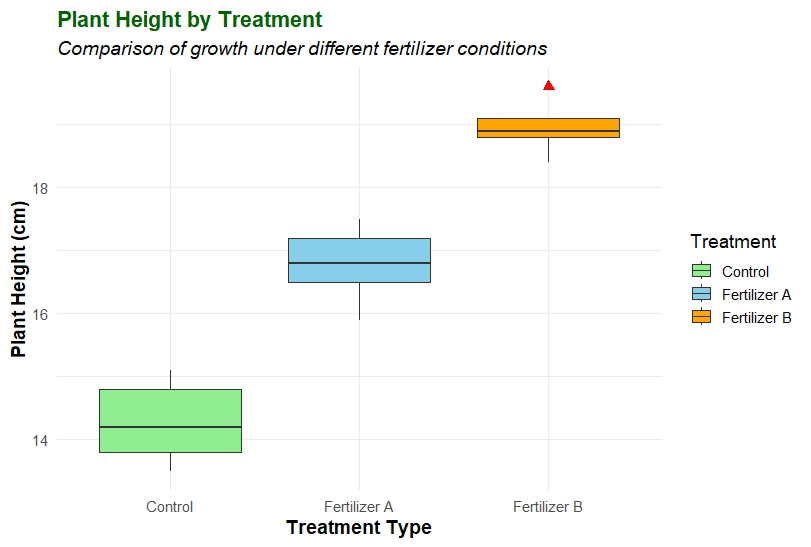
Box Plot in R Using ggplot2 | Step-by-Step Guide with Full Script and Interpretation
Introduction In biostatistics and data analysis, visualizing the distribution of
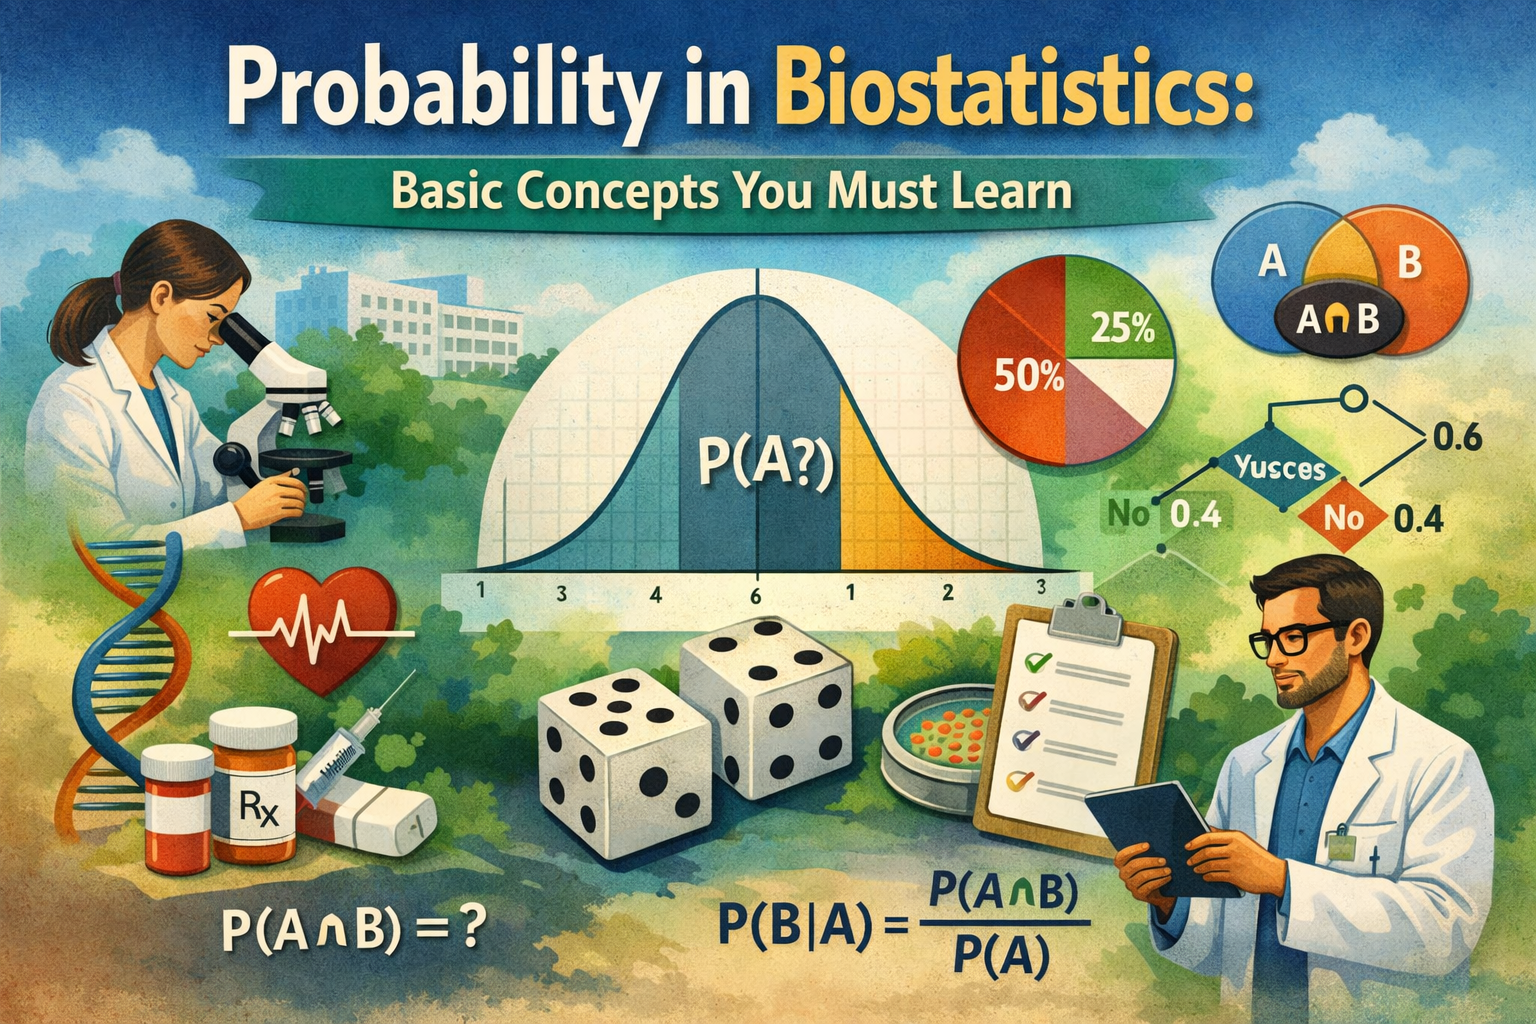


Probability in Biostatistics: Basic Concepts You Must Learn
Introduction Probability plays a foundational role in biostatistics, enabling researchers
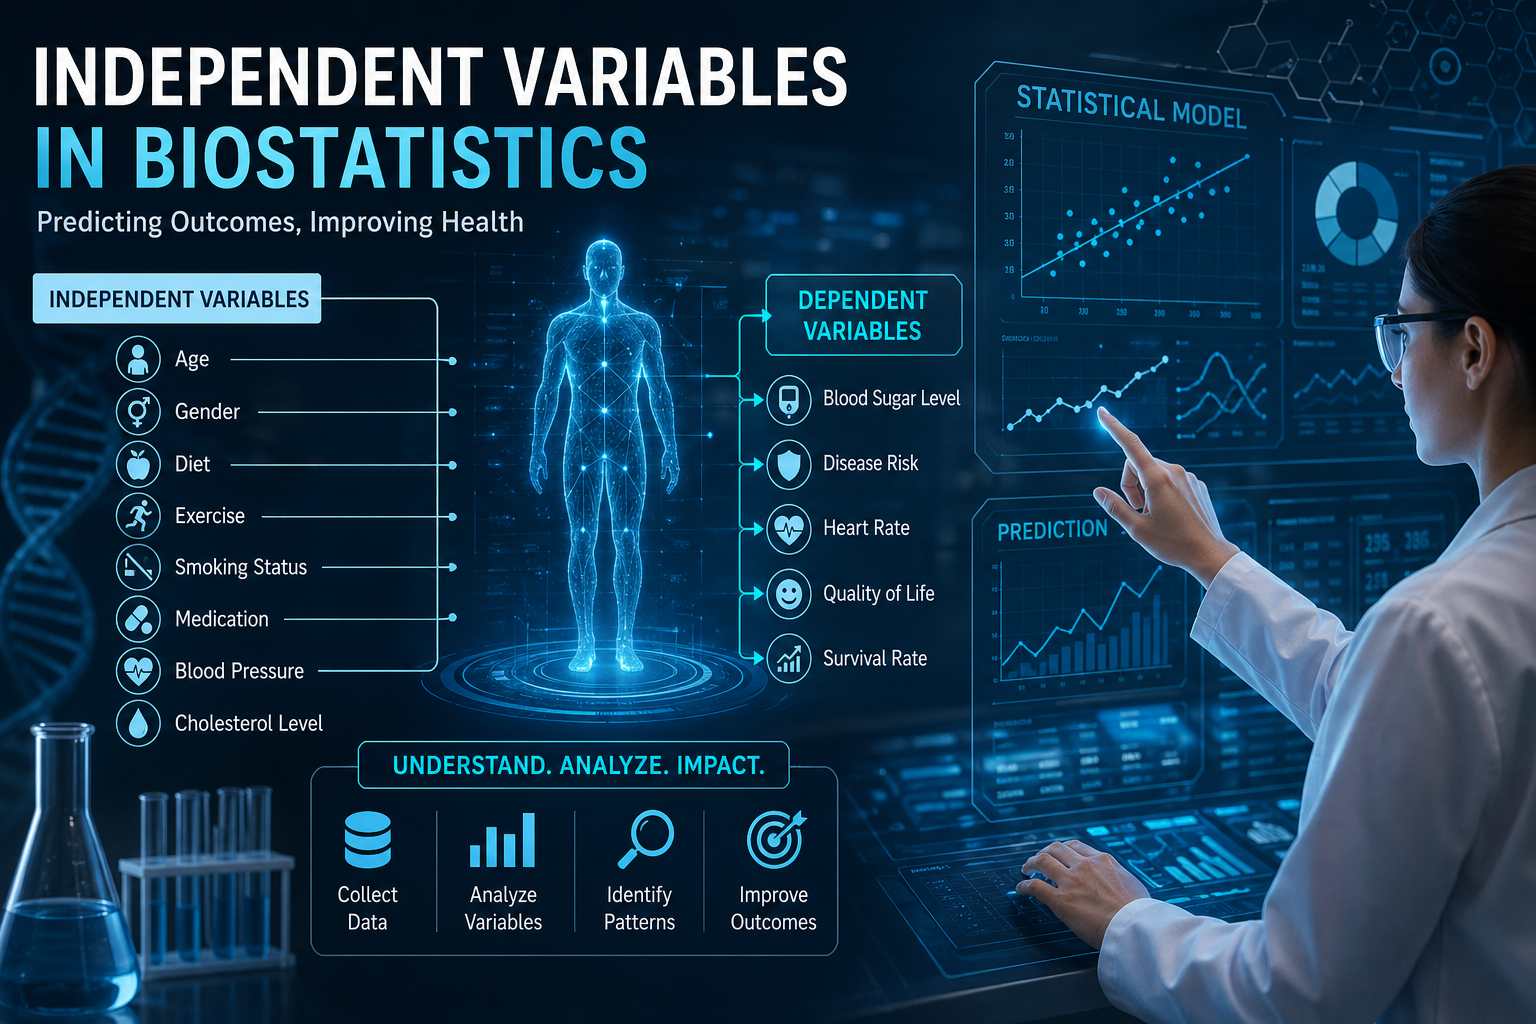
Independent Variables in Biostatistics: Concepts, Importance, and Applications
Introduction Biostatistics plays a vital role in understanding health-related data,
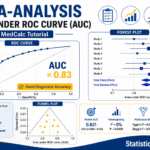
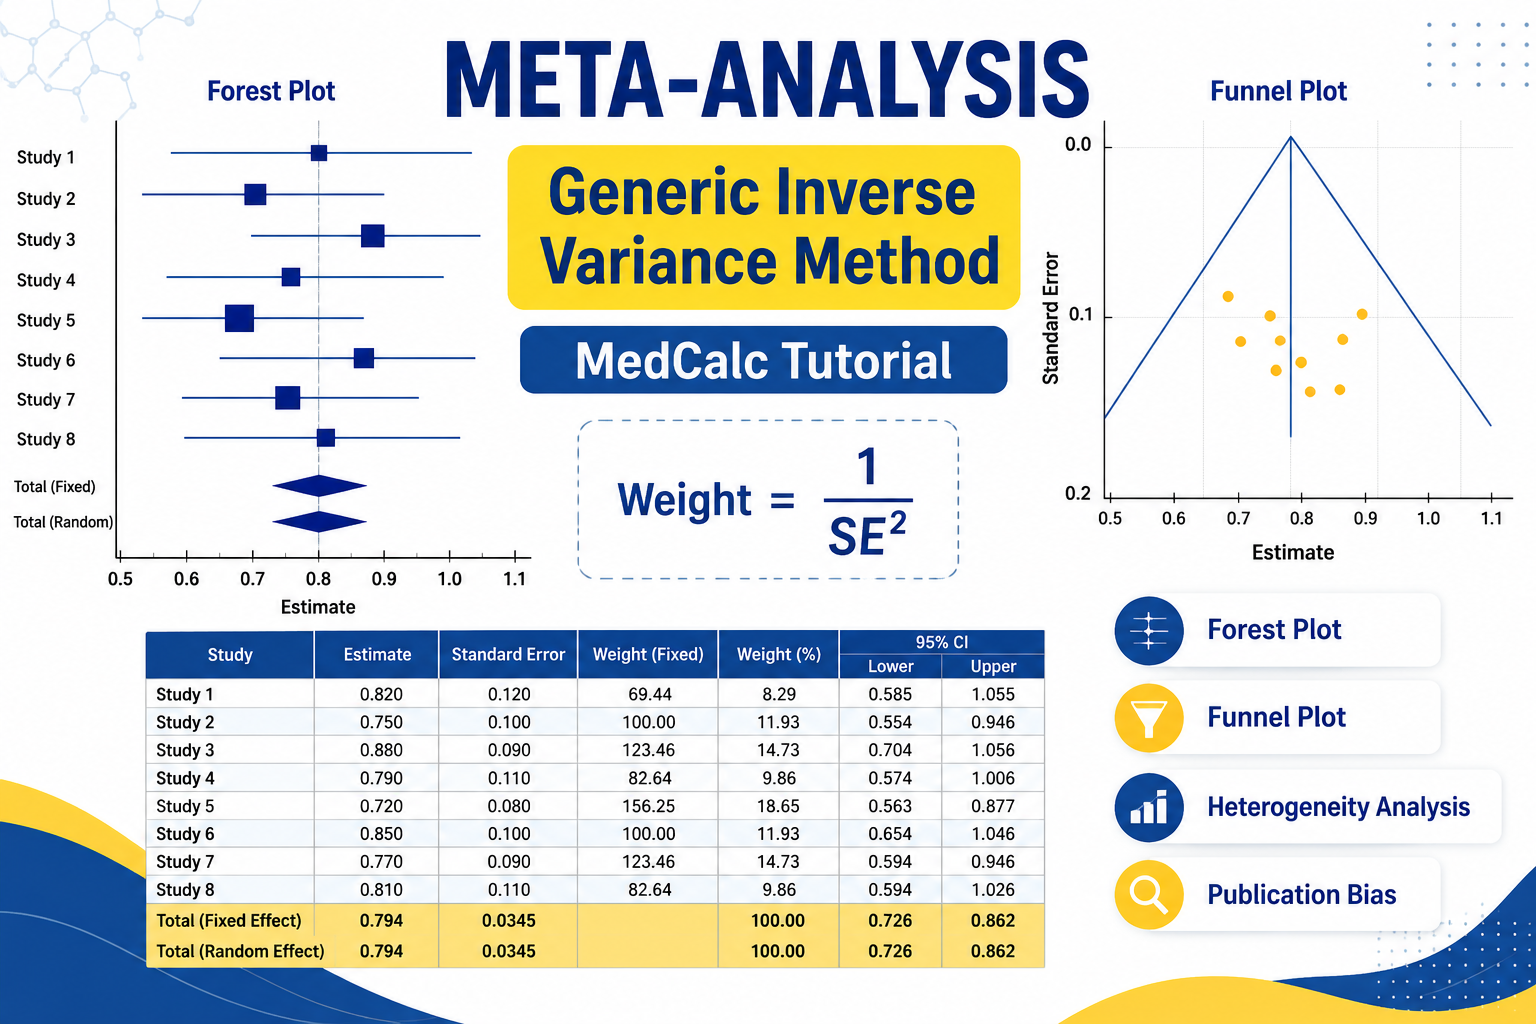
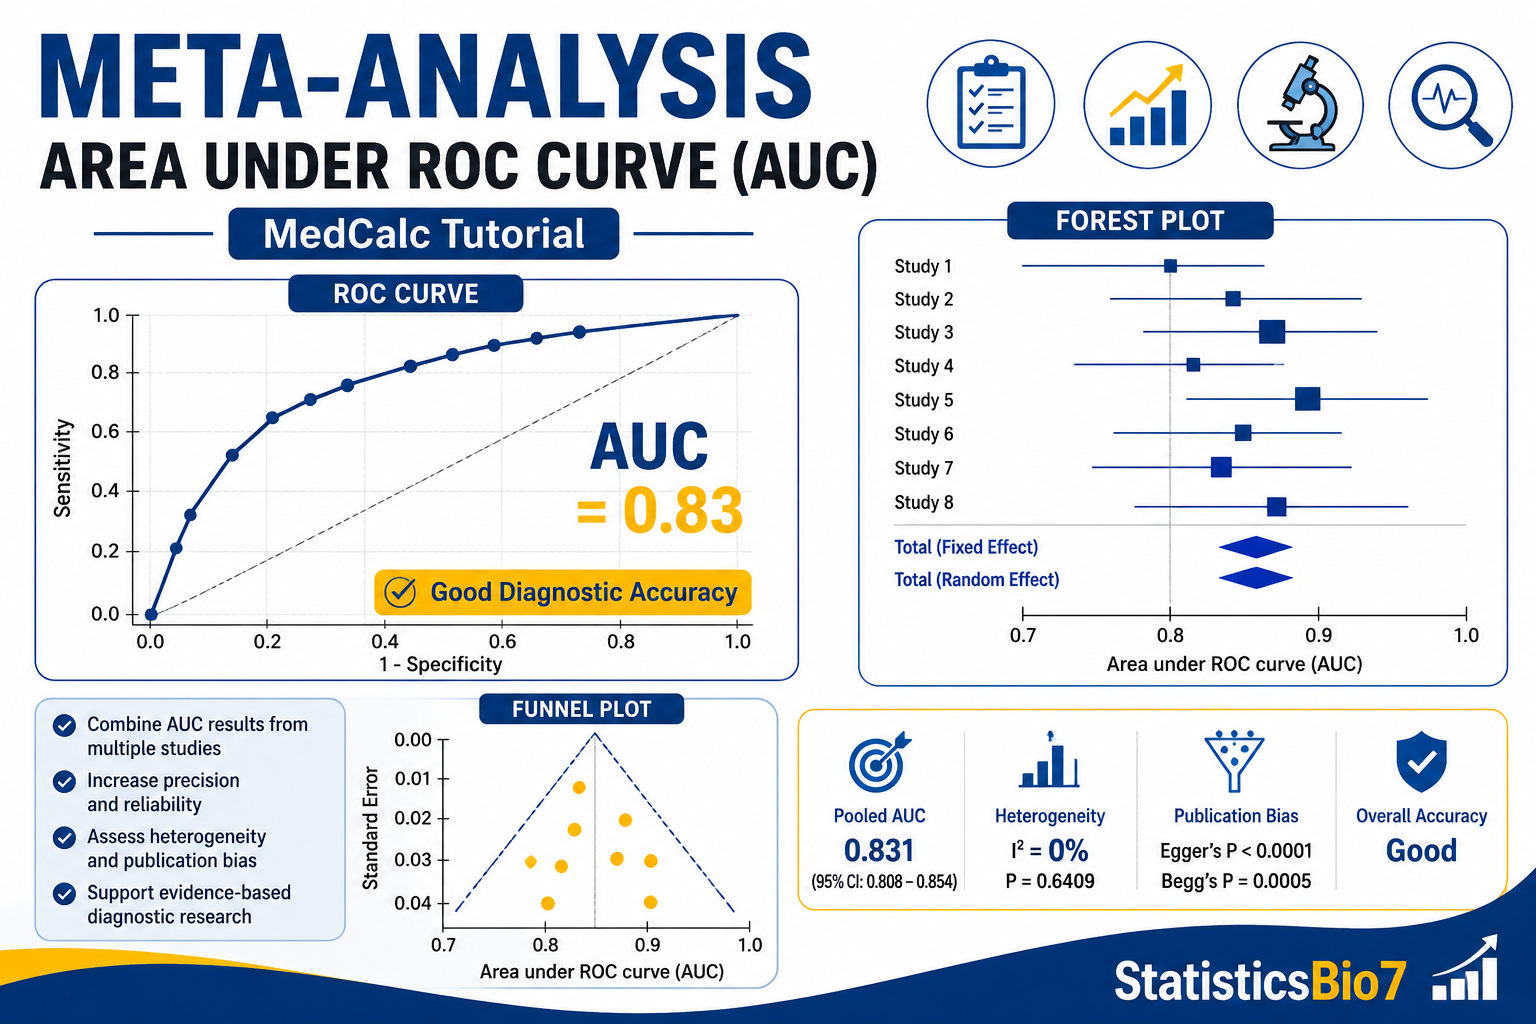
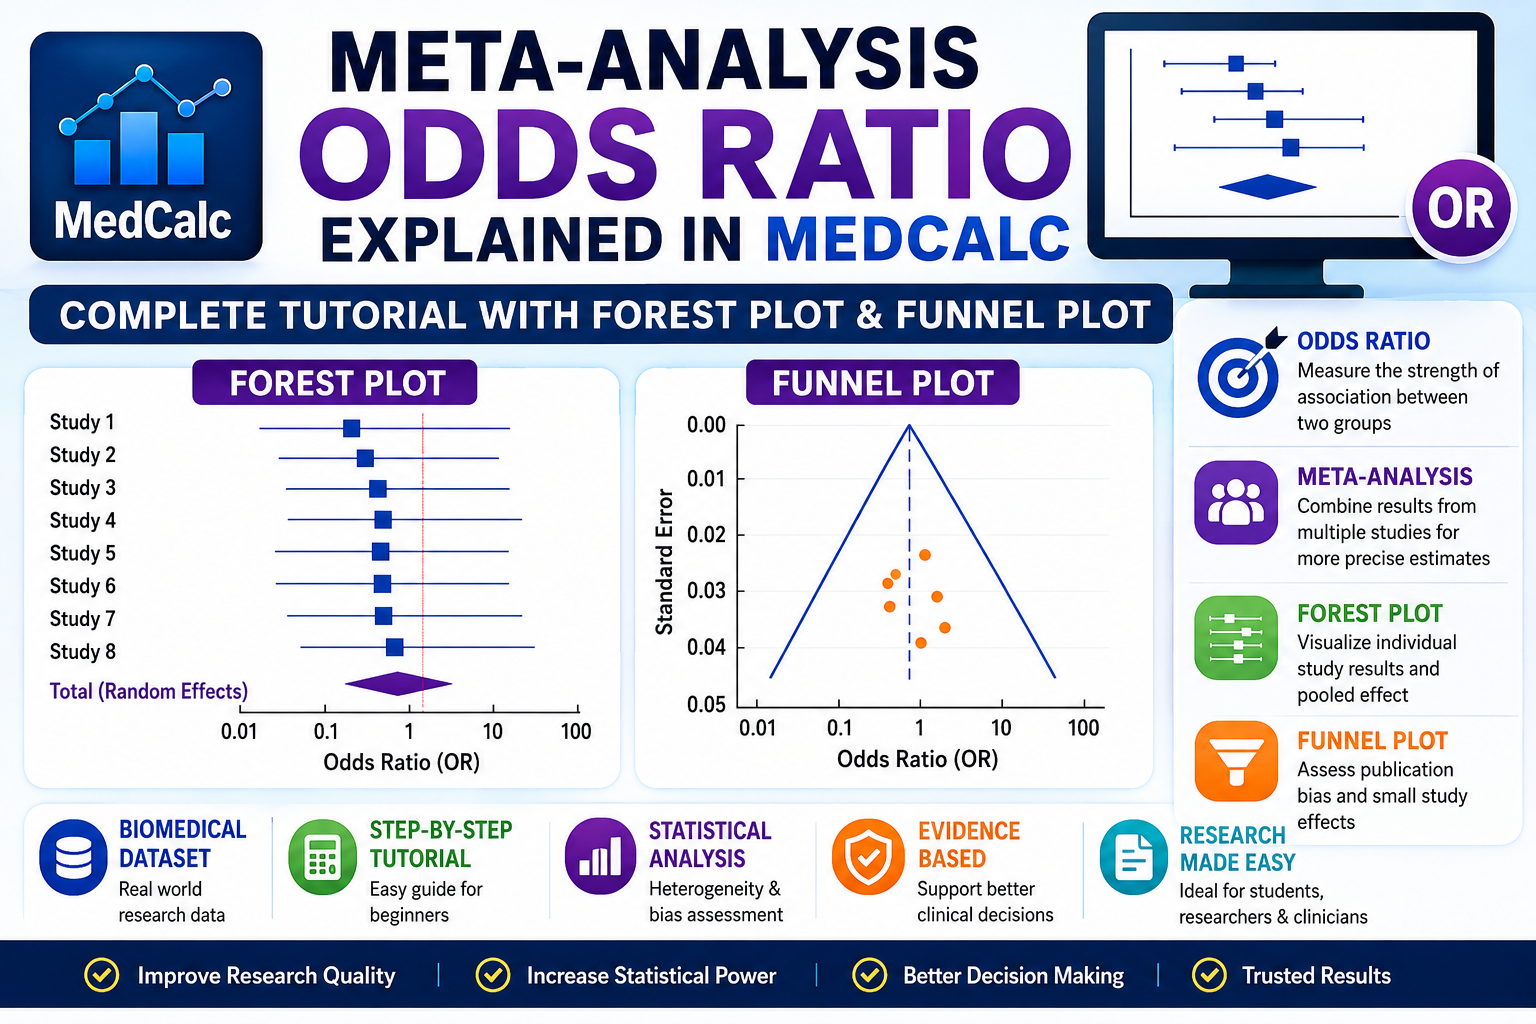
Meta-Analysis Area Under ROC Curve (AUC) in MedCalc: Complete Tutorial with Forest Plot & Funnel Plot
Introduction Meta-analysis is a statistical technique used to combine the
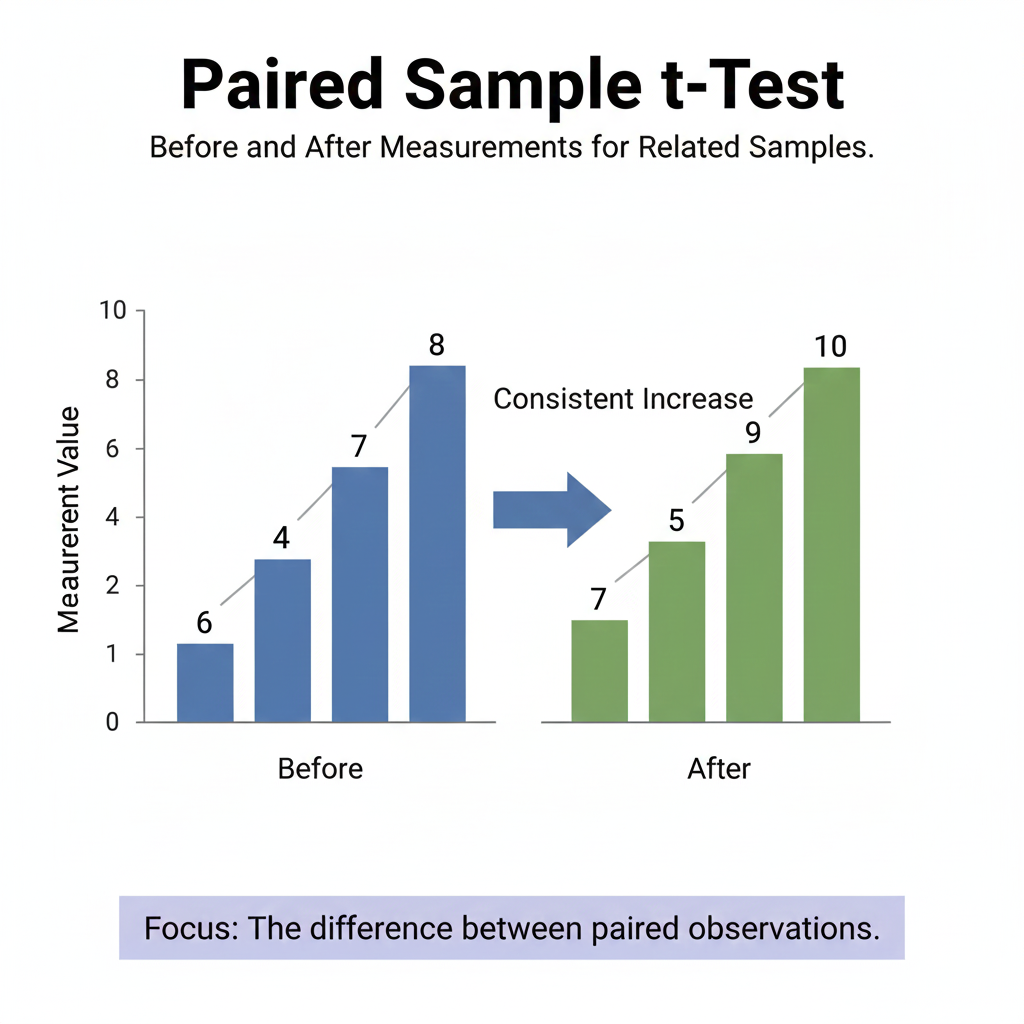
A Complete Guide to Understanding Paired t-Test for Before–After and Matched Data Analysis
Introduction The Paired Sample t-Test is one of the most
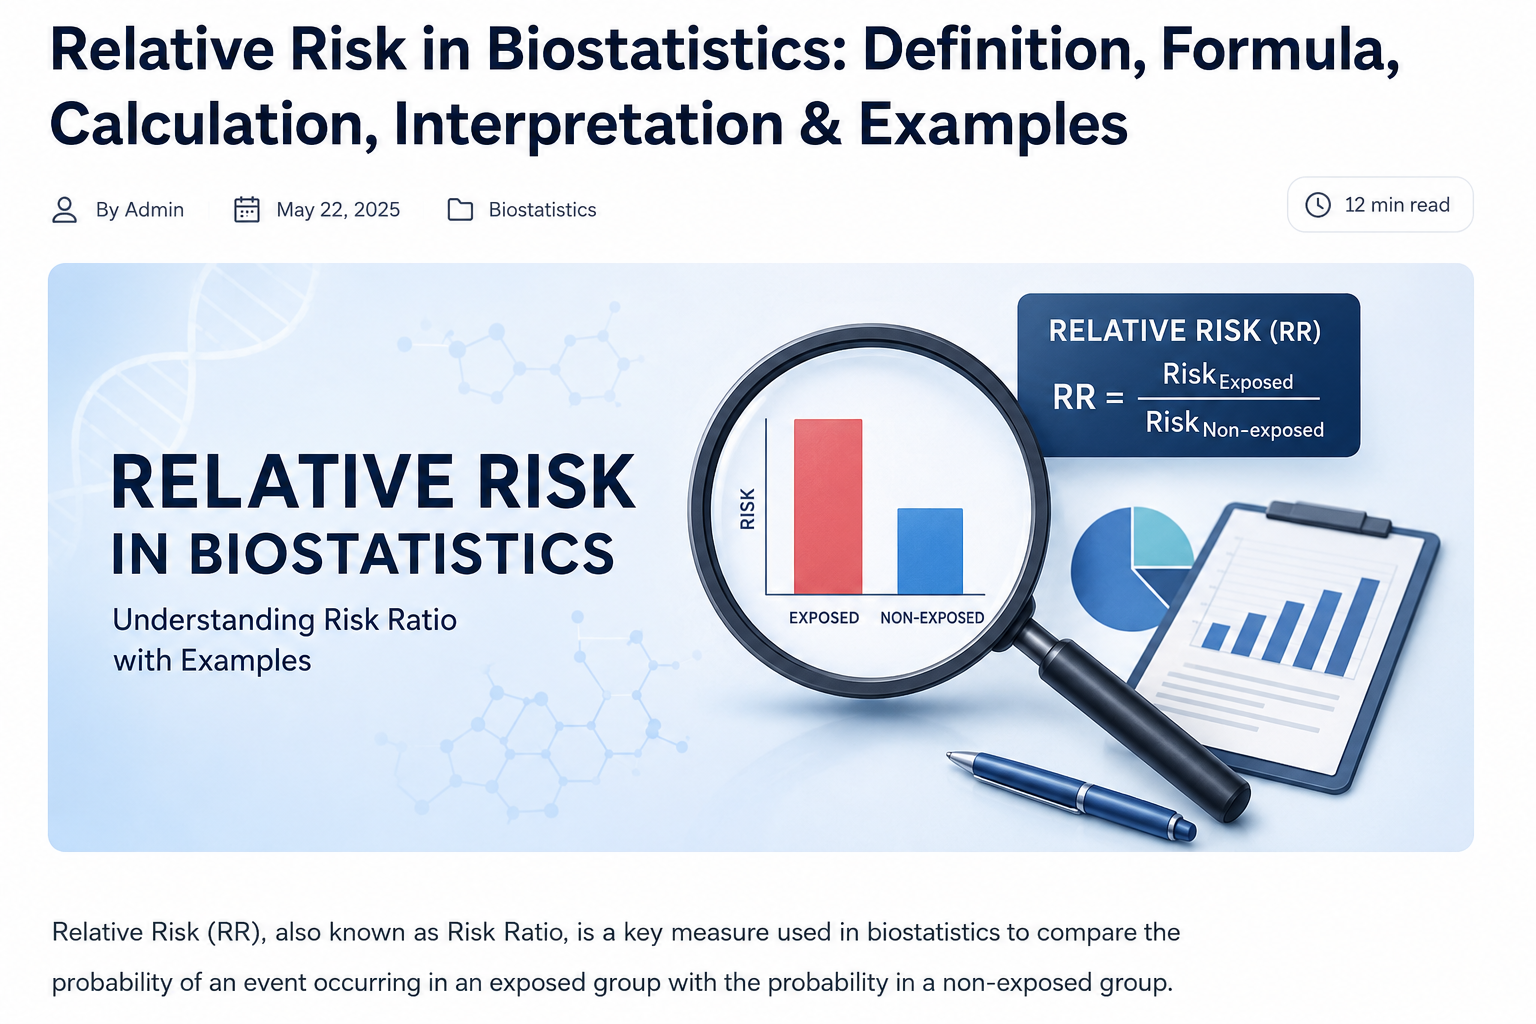
Relative Risk in Biostatistics: Definition, Formula, Calculation, Interpretation, and Examples
Introduction Relative Risk (RR) is one of the most important
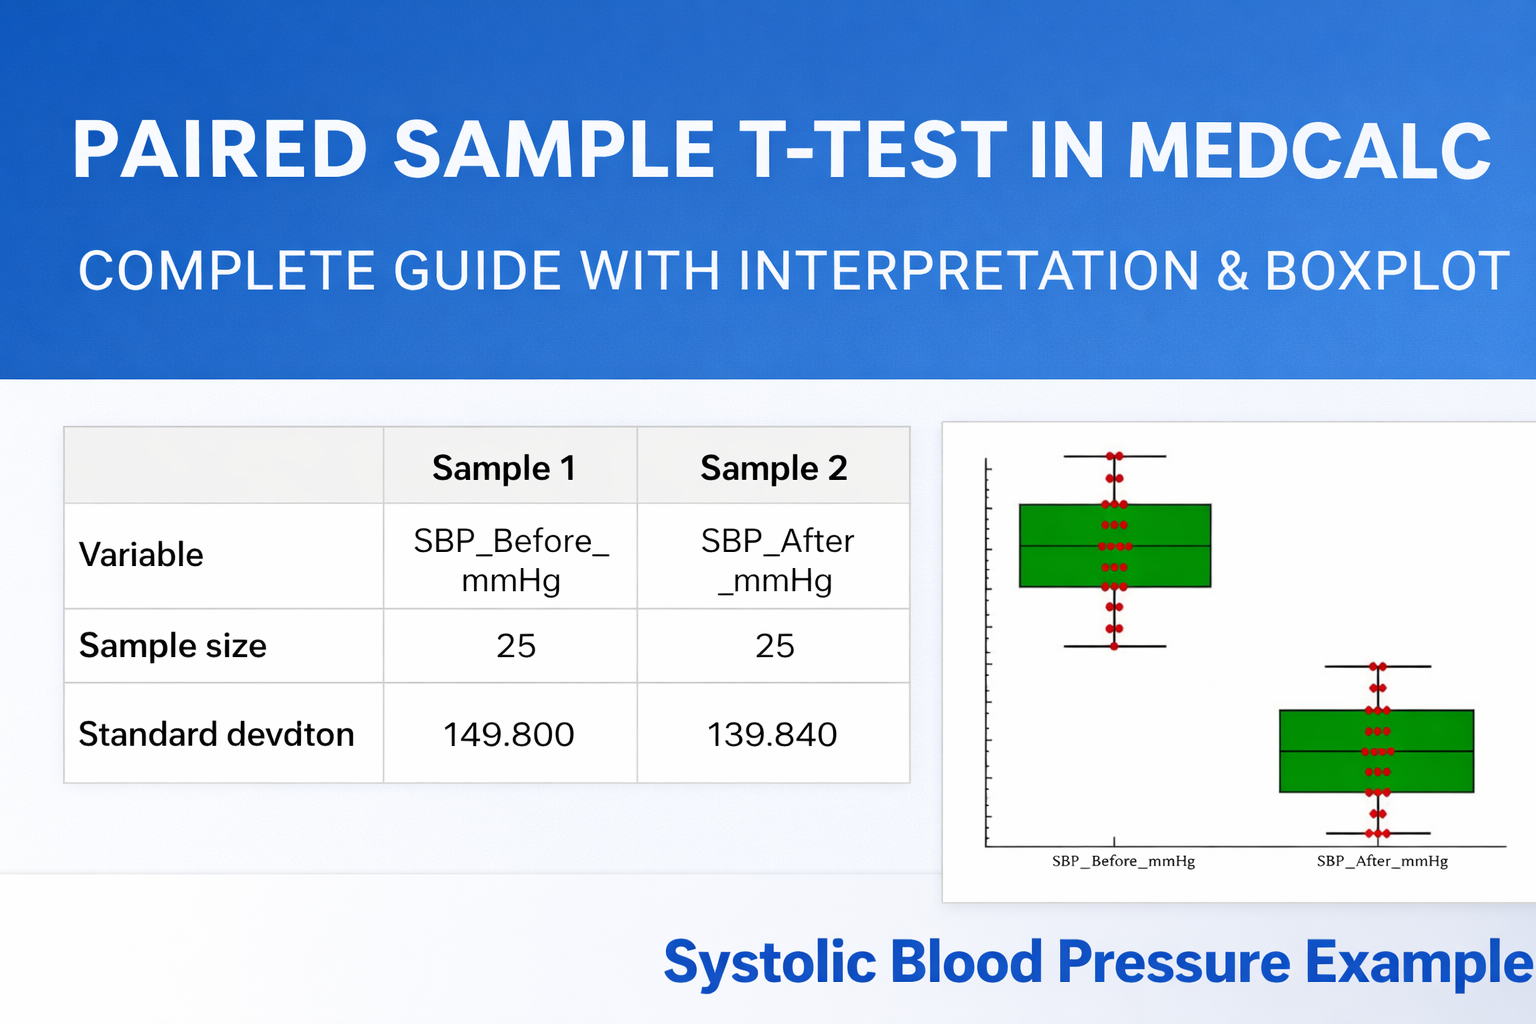
Paired Sample t-Test in MedCalc: Step-by-Step Analysis with Interpretation and Boxplot (SBP Example)
Introduction In medical and biological research, it is very common